Sports have long used efficiency ratings to analyze players. Made famous by the movie “Moneyball”, Oakland A’s general manager at the time, Billy Beane, used data-driven tactics to form and operate the baseball team. Unified Patents examined this approach in depth and found that there were no current solutions that could effectively, efficiently, and consistently rate law firms during patent prosecution on both an overall approach and per art unit approach.
Unified started from the premise of “Which law firms do a better job getting the (1) broadest and (2) most valid claims (3) allowed and at a (4) cheaper rate & at a (5) faster rate?" With this premise, three factors stood out to answer this question. The first being our Broadness Index (BRIX), the second being total applications, and finally pendency.
On a basic level, LPIX is the Normalized Value of (BRIX * Pendency * Total Applications^2). The formula squares the Total Applications factor to account for consistency. The comparison with the movie reference here would be at the bottom of the ninth, tied scored, two outs with bases loaded, do you want the player that maybe, one out of hundred times can hit the grand slam, or do you want the player that consistently gets on base giving the team a win? Using that same principle and applying it to patent prosecution, a client would want a firm that they know can consistently prosecute and file a high-quality patent each and every time.
LPIX currently consists of 3,153 law firms in their respective art units. Our coverage spans over 3 million office actions and 1 .7 million patents granted since 2008. It currently utilizes the Office Action Bulk Data set from the USPTO.
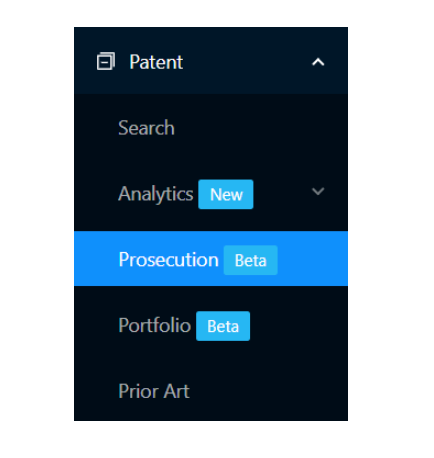
Portal now integrates this data and can show the overall scores of law firms, per unit basis, and also a combination of art units. Click on Prosecution under the Patent filter on the left in Portal:
The first table on the left shows the Top 20 Art Units in terms of Allowance Rate, while the middle shows the Top 20 Examiners in terms of Allowance. The third table on the right shows the Top 20 Law Firms sorted by LPIX. A user can also sort by Allowance Rate for the Law Firms as well.
By entering an Art Unit number, a user now can see the overall scores for that Art Unit. Below is an example where we typed “2872” and can see the scores and rankings for that particular art unit.
This analysis can be taken a step further by clicking on the individual Art Unit.
LPIX is divided into four quadrants. The green represents areas where a law firm is successful, as opposed to the red area where this represents law firms that were unsuccessful. In other words, the top right represents firms that are effective, efficient and consistent. The lop left would be the opposite in which firms are ineffective, inefficient, and inconsistent. The gray area represents law firms that may, for instance, be able to obtain broad patents in a faster time but are below the average in BRIX. Whereas the upper left, may be due to a longer pendency than average.
Here, the Y-axis represents BRIX, the X-axis represents the pendency to grant. The Z-axis, or the circle diameter, represents the total amount of applications.
The purpose of this graph is to show law firms that are efficient, effective, and consistent. This also allows companies to select law firms on their own criteria.
Users have the capability to analyze art units in a combined area. Our example below looks at air units 2871-2879:
LPIX is the only tool that accounts for both subjective and objective factors in measuring a law firm’s ability to achieve success during patent prosecution. Companies now have the ability to understand a law firm’s success in a given art unit, while being able to set their own patent strategy.
For more information about LPIX, please visit our support page.


